| Message: | Treetronic - Electrical Impedance Tomography (EIT) for trees
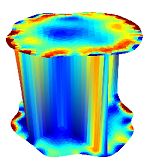
The PiCUS Treetronic uses electric current/voltage to examine the tree. The resulting measurements are displayed in a two-dimensional map showing the apparent electrical impedance of the wood, called an Electrical Impedance Tomogram (EIT). The electric impedance - or resistance - of the wood is influenced most of all by the water content, cell structure and chemical elements which change according to the status of wood. The Treetronic can detect such changes by measuring how the heterogeneous wood “bends” the electrical field.
When used in combination with a Sonic Tomograph, an EI tomogram offers you more information about the tree. The EIT helps to analyse the type of damage, and it is often possible to distinguish between cavities and ‘wet’ diseased wood.
Advantages of the combined analysis of SoT and EIT
When analysing both SoT and EIT it is often possible to
distinguish between different types of damage (for instance crack/cavity vs. decay) in many cases
detect early stages of decay
get information about areas above or below the measuring level. This is interesting for analysing root decay problems.
Example
The SoT of this beech shows a typical pattern for a fungus infection: the centre of the tree does NOT have the darkest colours (i.e. highest sonic velocity), but only lighter browns. The EIT clearly shows a high conductive centre (blue colours), which is a clear indication for fungus activity. The EIT on the right shows the typical resistivity distribution in a healthy beech tree:
SoT @ 5 cm above ground EIT: blue = low resistance For reference: EIT of sound beech
Producing Area:Germany |
 my account
 log out
 my account
 log out
